This is an old revision of the document!
Table of Contents
Point Clouds Processing and Interpretation
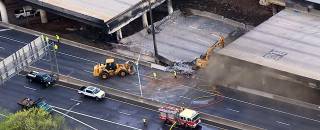
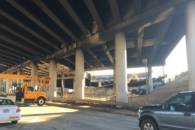
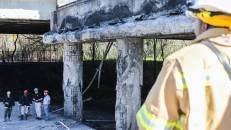
Recently, a section of the I-85 in Atlanta collapsed due to a human-caused fire (images below). The accident impacted Atlanta traffic and led to the closure of the I-85 in both directions in the vicinity of the damaged section.
Due to the impact of the accident, damage removal, traffic control, and construction of the new section began almost immediately.
Of course, the authorities also wanted to document the state of the bridge. As part of the damage assessment, the Georgia Department of Transportation needs to create a post-disaster scan of the bridge and compare it to a scan performed earlier, when the bridge was fully intact. The scan analysis will also assist in the repair as it will provide important geometric information regarding the section.
Bridge Comparison and Visualization
Let's go through a simulated version of the analysis. With the current tools in hand, you should be able to identify the missing components from the original laser scans. Now, these “laser scans” are far larger than what you have been dealing with so far, so your algorithms to date may not work out of the box due to memory constraints. We'll break this problem into a few smaller problems that will lead towards the final answer.
Part #1: Difference Calculation
The laser scanning folk were nice enough to register the original scan to the new scan, so they are both in the same coordinate system (i.e., they have a common origin). that means, you can directly check the point clouds to see what differences there are. Eventually, we'd like to quantify the differences not in terms of points, but in terms of surfaces. Since the point cloud is too big, we'll need to partition it too.
Proximity Check
Let's first see if we can identify the difference in the bridge due to both the collapse of the bridge, as well as due to the burning of some of the components. Create a new member function for your pts3D class that takes in another pts3D object (call it the testCloud) and a distance threshold ($\rho_{dist}$), then returns the indices into the points of the testCloud that are more than ($\rho_{dist}$) away from the points in the calling point cloud. For that, you may also want to create a member function called distanceToPoints. The idea is to be able to invoke a member function as follows:
farPointInds = sourceCloud.getDifference(testCloud, rho);
and have it pass back the indices to the points in testCloud that are far away from the points in sourceCloud (as in a distance more than rho).
To aid this procedure, write a member function called distanceToPoints whose stub is:
function [minDist, minInd] = distanceToPoints(this, testPts)
...
end
Cleverly using pdist you can find both the minimizing distance and the associated index for the return arguments.
Your main function getDifference should invoke it and then perform the distance thresholding to identify the outlier points and returns their indices.
You should also write a member function called removeInds
function remPts = removeInds(this, inds)
...
end
that takes a set of indices to remove, removes the points from the point set, and returns a new point set (e.g., a pts3D object) with the removed points. Using this removal function, you should visualize the set of points that are outliers, so you can visualize what parts of the bridge were damaged or altered in the fire.
====


